Alerting — New in v0.5.5
Failure happens.
Get notified instantly.
Every playbook run is assessed automatically. Failures trigger all configured channels simultaneously — no manual steps, no monitoring. NeuRader fires and forgets.
Slack
PagerDuty
MS Teams
Jira
Email
Telegram
Webhook
Alertmanager
One run = one assessment.
No noise, no duplicates.
Success → Slack / Teams / Telegram only
Clean success message. No ticket. No page. No noise.
Failure → Full incident across all channels
Slack + PagerDuty page + 1 Jira ticket with all failed hosts and full task details.
10 hosts failed = 1 Jira ticket
All failed hosts in one ticket. NeuRader never monitors or auto-closes — engineer owns resolution.
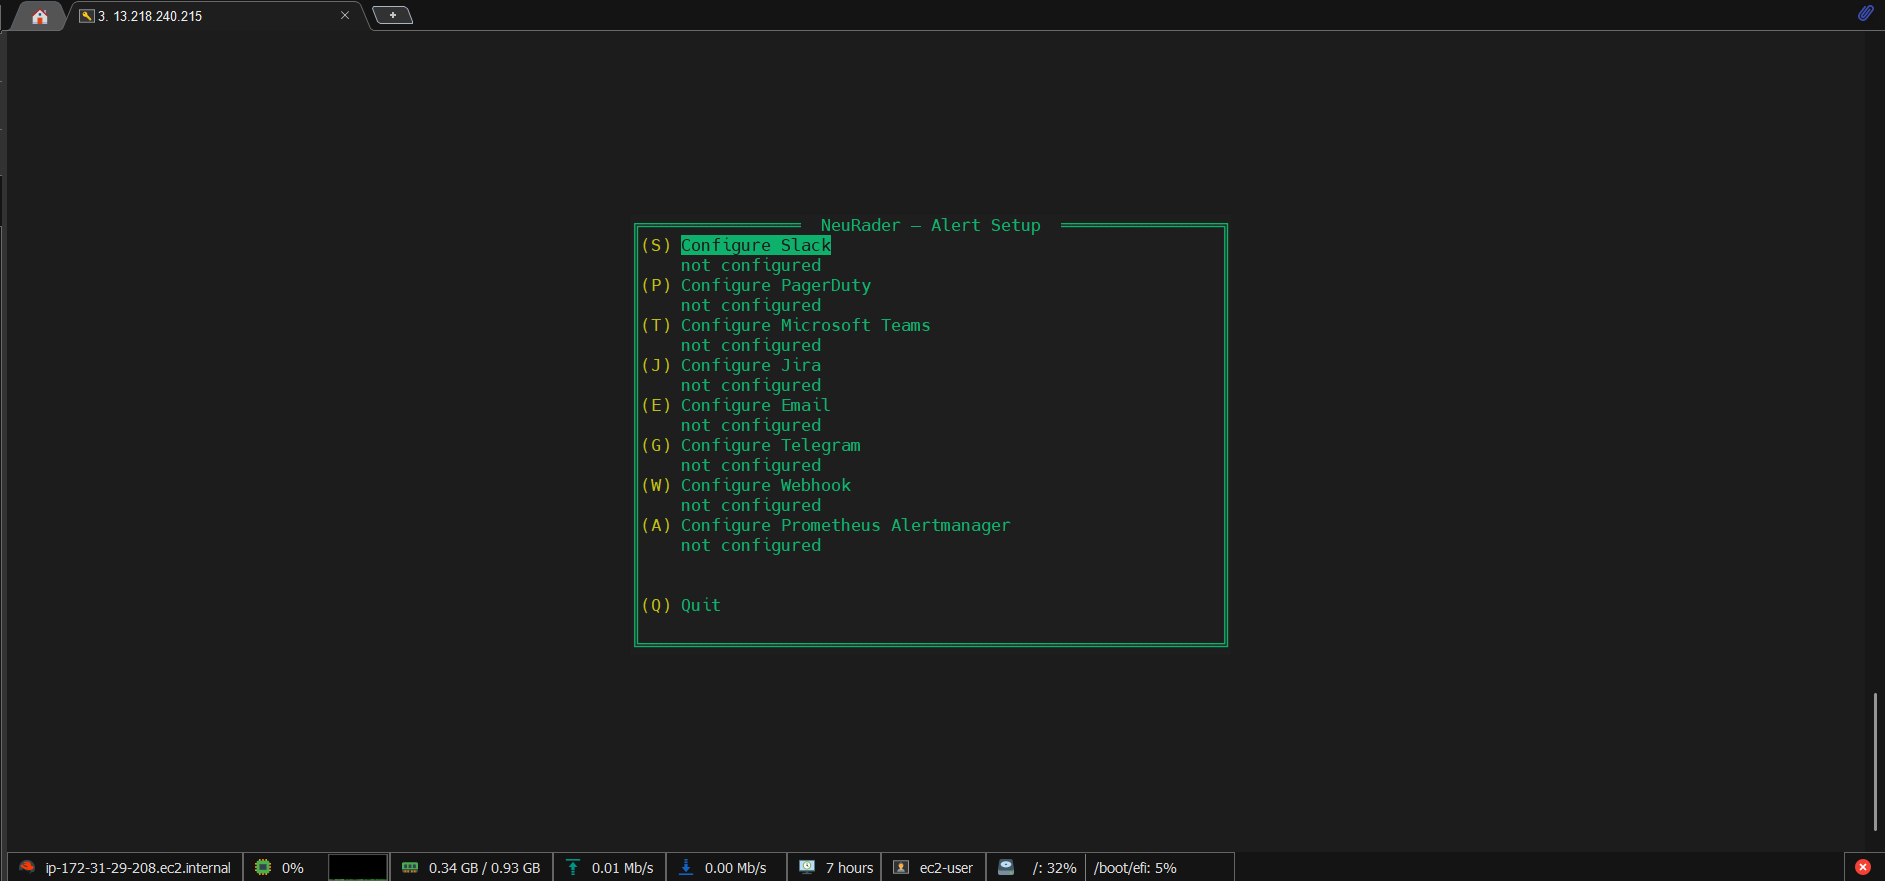
neurader alert-setup
Playbook Runs
You run ansible-playbook as usual. NeuRader callback captures everything silently in the background.
NeuRader Assesses
post-run reads the log, identifies failures, collects host names, task details, modules, args, stderr.
Alerts Fire
All configured channels fire simultaneously — Slack, PagerDuty, Jira — in under one second.
Configure with neurader alert-setup — interactive green TUI, no config files needed
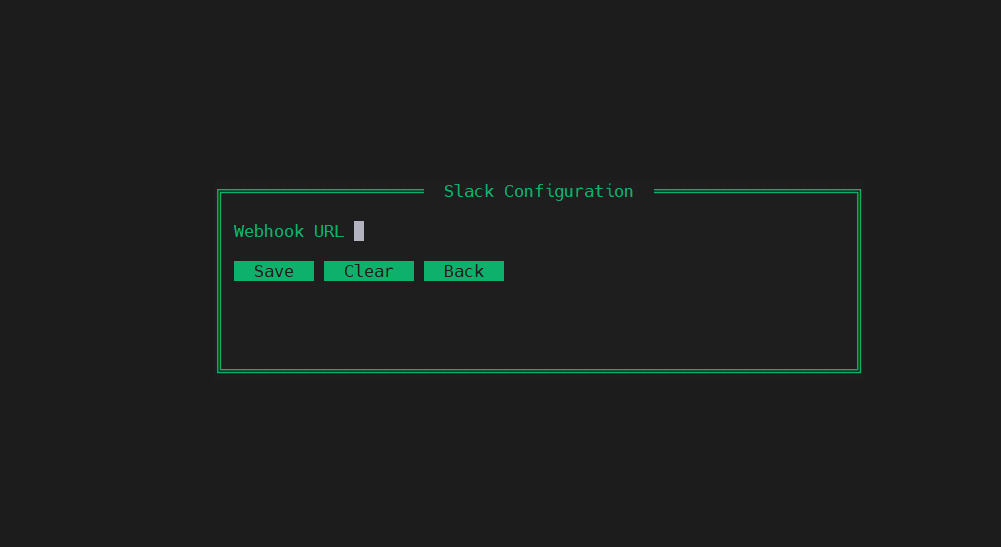
Slack
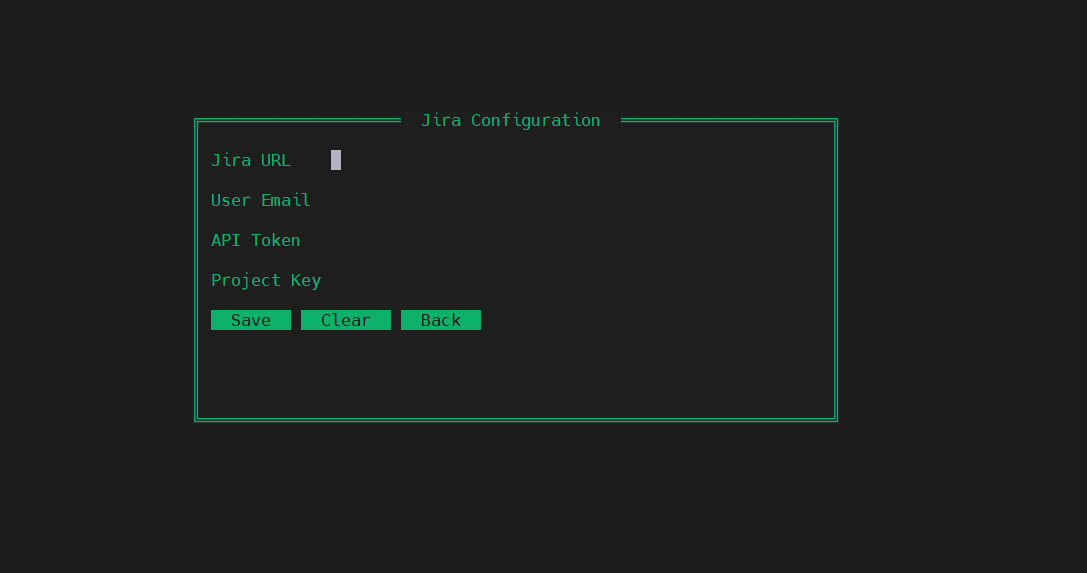
Jira
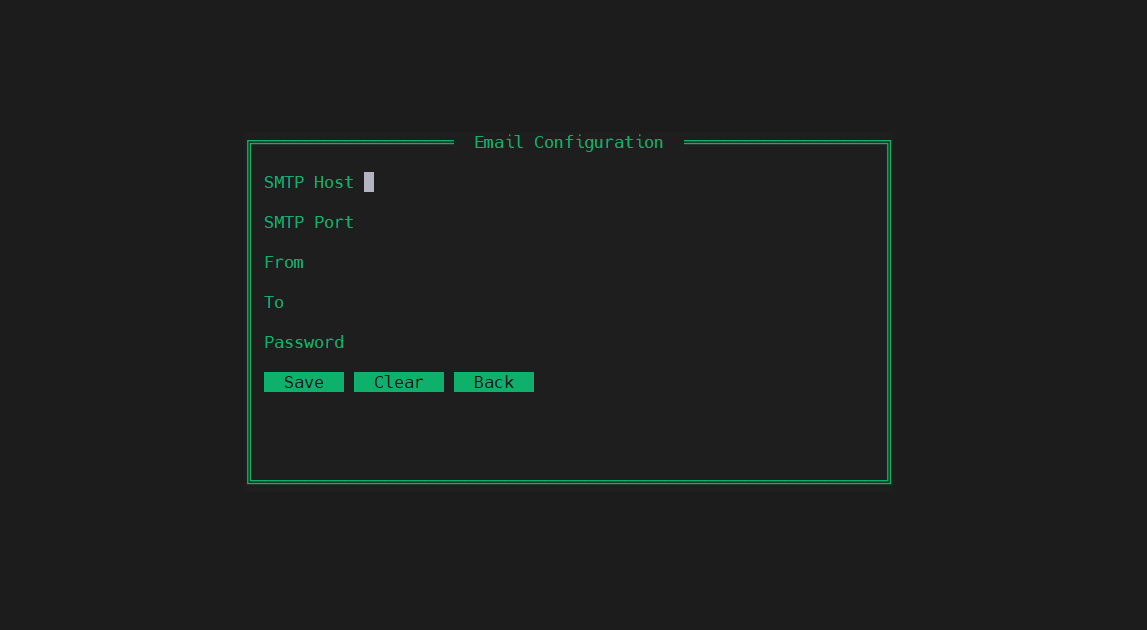
Email (SMTP)